Web & Software Development
Dashboards
Operational visibility, not vanity charts.
Overview
A dashboard earns its place when it changes a decision. We design around the questions your team actually asks each week, then build the pipeline that keeps the answers current and trustworthy.
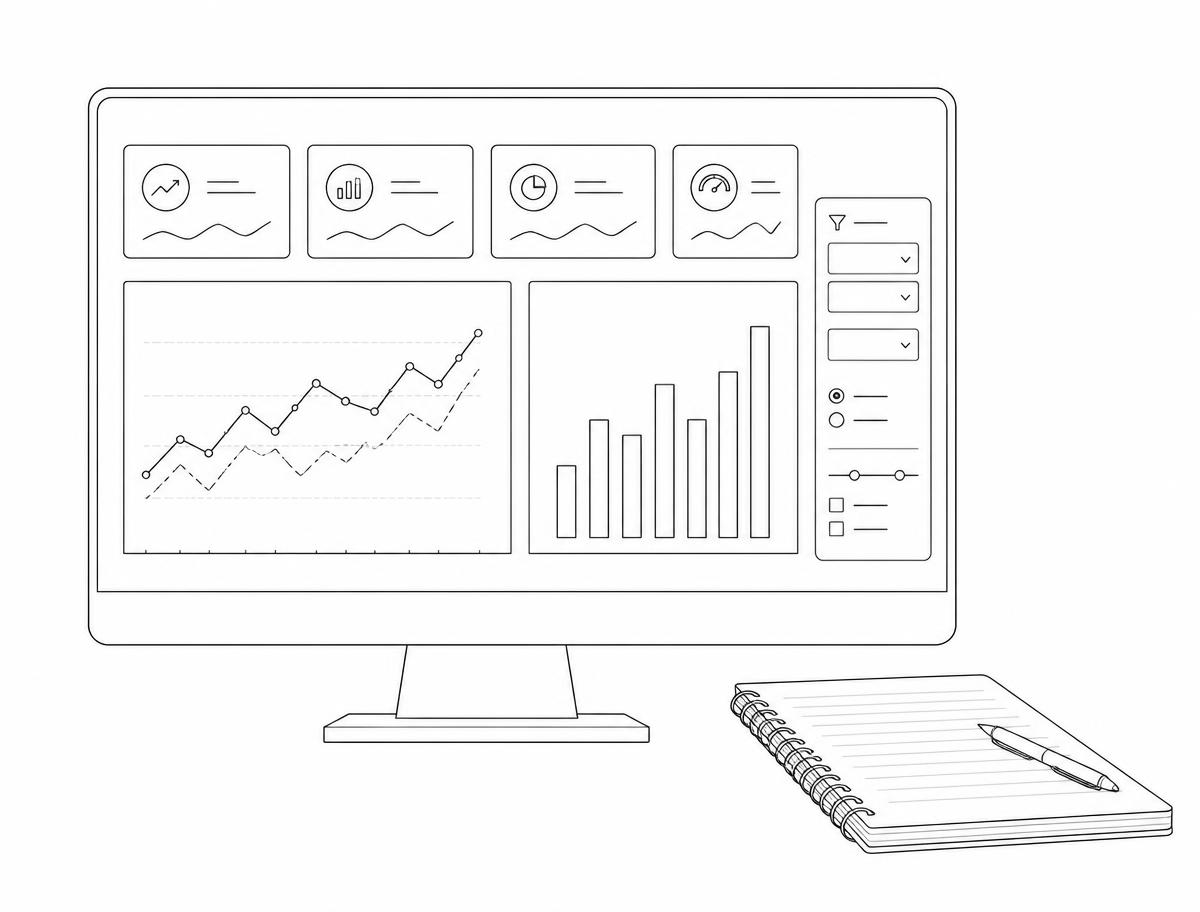
We build dashboards on top of a defined data model, so metrics are consistent, current and traceable to their source.
The problem
- Reporting lives in exports and manual spreadsheets.
- Nobody agrees on which number is correct.
Our solution
We build dashboards on top of a defined data model, so metrics are consistent, current and traceable to their source.
Business benefits
What changes for the business
The operational outcomes this service is designed to produce.
Decisions, not decoration
Every view answers a question someone is already asking.
Trustworthy numbers
Defined metrics and validated pipelines behind each figure.
Current by default
Scheduled or streaming refreshes keep data live.
Shareable output
Exports for board packs, client reporting and internal reviews.
Capabilities
What's included
Use cases
Where this is applied
- 01Executive reporting
- 02Operations monitoring
- 03Analytics for teams
Industries
Sectors that benefit most
This service is frequently part of solutions we design for these industries.
How we work
A process built around clarity
Discover
Understand the business, challenges, goals and requirements.
Analyse
Identify opportunities for AI, automation, software or data solutions.
Design
Plan the user experience, technical architecture and solution.
Build
Develop and integrate the solution.
Deploy
Launch the solution and ensure it works reliably in production.
Support
Maintain, improve and scale the solution as the business grows.
FAQ
Frequently asked
Next step
Discuss your project
Tell us where dashboards could fit in your business, and we'll tell you honestly whether it's the right move.